M2.1 Epipelagic ocean waters
M2. Pelagic ocean waters biome
M2
Profile summary
Full profile at https://global-ecosystems.org/explore/groups/M2.1
Brief description
This uppermost ocean layer (0-200m depth) is the most influenced by the atmosphere, and is defined and structured by light availability. Photosynthesis in these ecosystems accounts for half of all global carbon fixation. That productivity supports diverse marine life, including many visual predators, like tuna, that rely on the high light environment. Migration is a common life history trait across all groups: either vertical – rising from the depths to feed at the surface at night to evade daytime predators; or horizontal – between breeding and feeding grounds. Detritus from this zone is an important nutrient source for lower oceanic layers.
Key features
Uppermost euphotic ocean, where phytoplankton production supports abundant mobile zooplankton, fish, cephalopods, mammals and seabirds.
Overview of distribution
Surface layer of the open ocean.
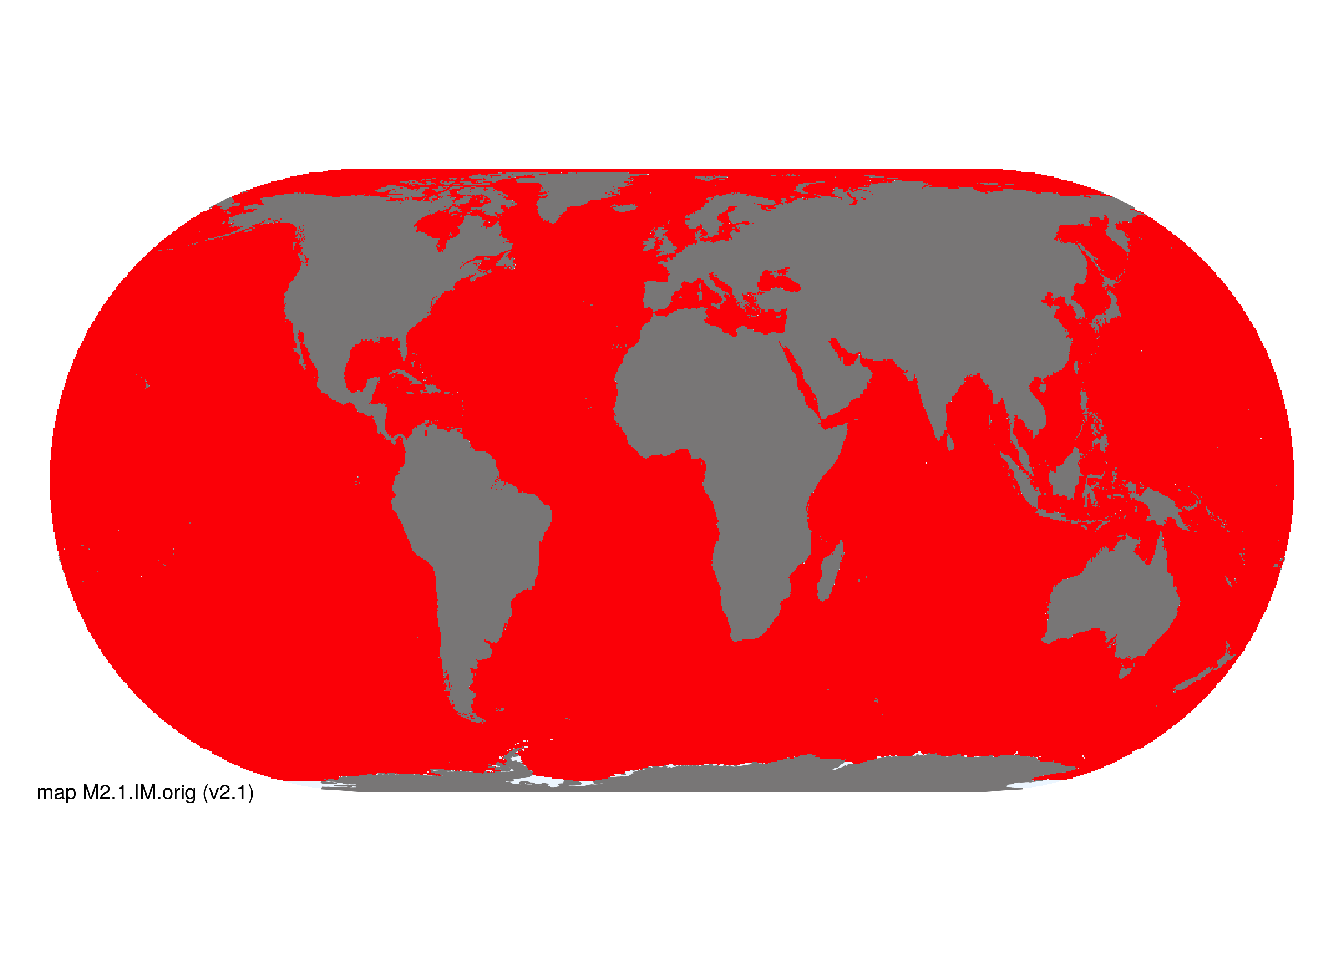
Map description
Indicative distributions of these marine pelagic ecosystem functional groups were derived from bathymetric spatial data obtained from Becker et al. (2009) using depth range thresholds cited in respective descriptive profiles for each functional group. Occurrences were mapped at 30 arc second spatial resolution..
Map code and version: M2.1.web.orig v2.1, available at ![]()
Version history
Profile versions
- v2.1 (2022-04-06): KE Watermeyer; RR Rykaczewski; IG Priede; TT Sutton; DA Keith.1
- v2.01 (2021-12-31): NA.
- v2.0 (2020-05-27): KE Watermeyer; RR Rykaczewski; IG Priede; TT Sutton; DA Keith.
- v1.0 (2020-01-20): KE Watermeyer; DA Keith.
Available maps
Read more details about the current map versions here.
- Web navigation (code: M2.1.web.orig, version v2.1)

- Indicative Map (code: M2.1.IM.orig, version v2.1)
Read more details about older or alternative versions of maps for this functional group.
- Indicative Map: discarded (code: M2.1.IM.orig, version v2.0)
- Web navigation: discarded (code: M2.1.web.orig, version v2.0)
- Indicative Map: discarded (code: M2.1.IM.orig, version v1.0)
- Web navigation: in preparation (code: M2.1.WM.nwx, version v1.0)
- Web navigation: discarded (code: M2.1.web.orig, version v1.0)
References
Main references
References used in the different versions of the profiles.
- Anderson TR, Martin AP, Lampitt RS, Trueman CN, Henson SA, Mayor D J (2019) Quantifying carbon fluxes from primary production to mesopelagic fish using a simple food web model ICES Journal of Marine Science 76, 690–701
- Stal LJ (2016) The euphotic realm The Marine Microbiome (Eds. LJ Stal, MS Cretoiu), pp. 209-225. Springer, Switzerland.
- Sutton TT (2013) Vertical ecology of the pelagic ocean: Classical patterns and new perspectives Journal of Fish Biology 83: 1508‐1527
Map references
References used in the different versions of the maps (current and discarded).
- Becker JJ, Sandwell DT, Smith WHF, Braud J, Binder B, Depner J, Fabre D, Factor J, Ingalls S, Kim S-H, Ladner R, Marks K, Nelson S, Pharaoh A, Trimmer R, Von Rosenberg J, Wallace G, Weatherall P (2009) Global Bathymetry and Elevation Data at 30 Arc Seconds Resolution: SRTM30_PLUS, Marine Geodesy 32: 355-371. DOI:10.1080/01490410903297766
- Sayre, R.G., D.J. Wright, S.P. Breyer, K.A. Butler, K. Van Graafeiland, M.J. Costello, P.T. Harris, K.L. Goodin, J.M. Guinotte, Z. Basher, M.T. Kavanaugh, P.N. Halpin, M.E. Monaco, N. Cressie, P. Aniello, C.E. Frye, and D. Stephens (2017) A three-dimensional mapping of the ocean based on environmental data Oceanography 30(1):90–103 DOI:10.5670/oceanog.2017.116
Footnotes
This is the current version available at official site.↩︎