Appendix A — Graphical overview of data, analysis and results
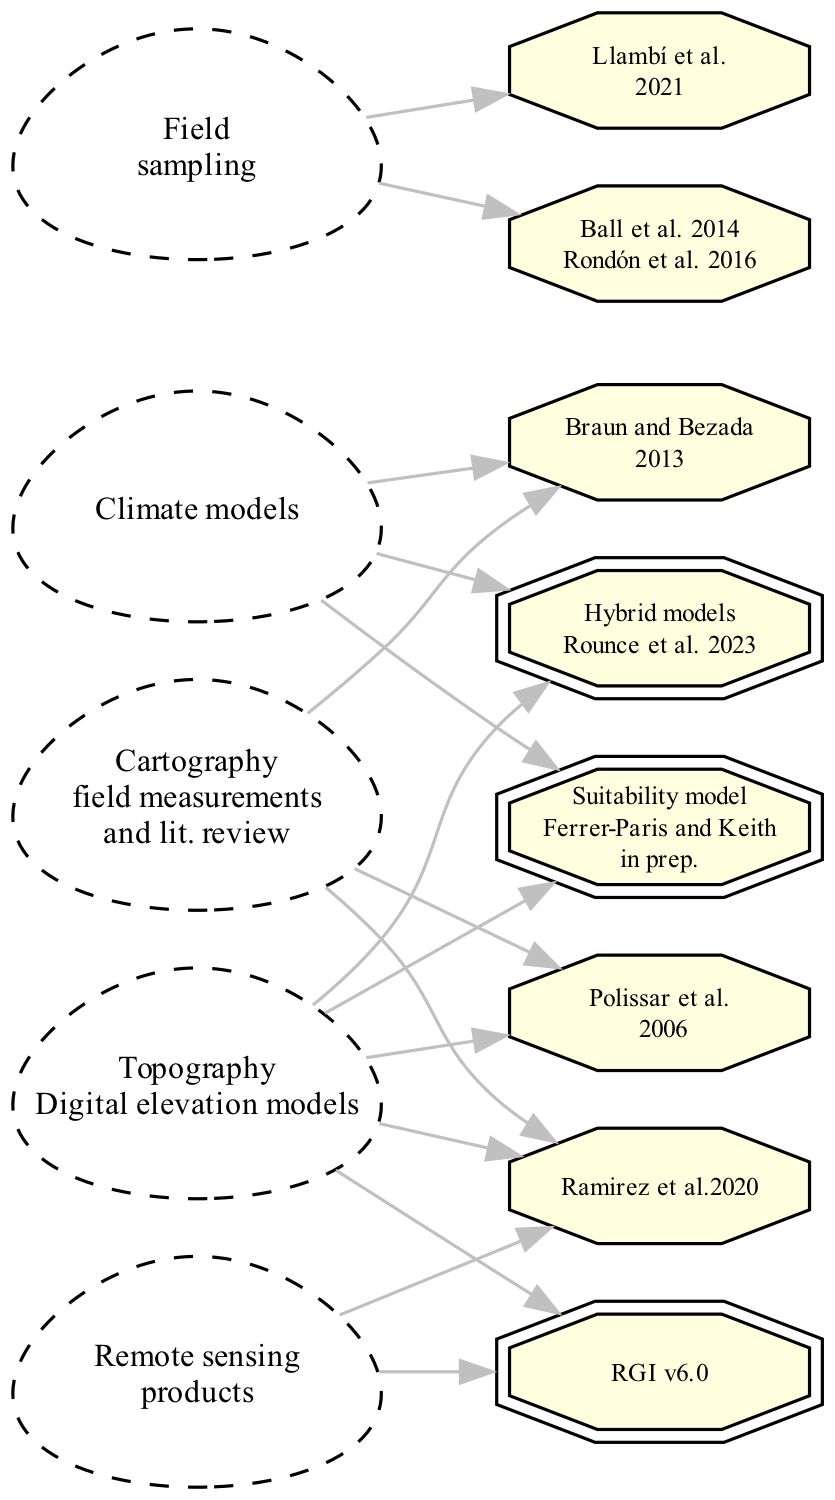
The assessment is based on three local studies (Polissar et al., 2006; Braun & Bezada, 2013; Ramírez et al., 2020) two references that provide global data (Randolph Glacier Inventory Consortium, 2017; Rounce et al., 2023), and unpublished analysis. Additional local studies could inform assessment of biotic components, but data was considered insufficient for risk assessment (Llambí et al., 2021). Figure A.1 shows the different types of input data that is related with each publication or dataset.
The Figure A.2 shows a simple workflow of input data (grey boxes) provided by the references and additional steps of analysis (white boxes) that lead to the evaluation of each sub-criterion.
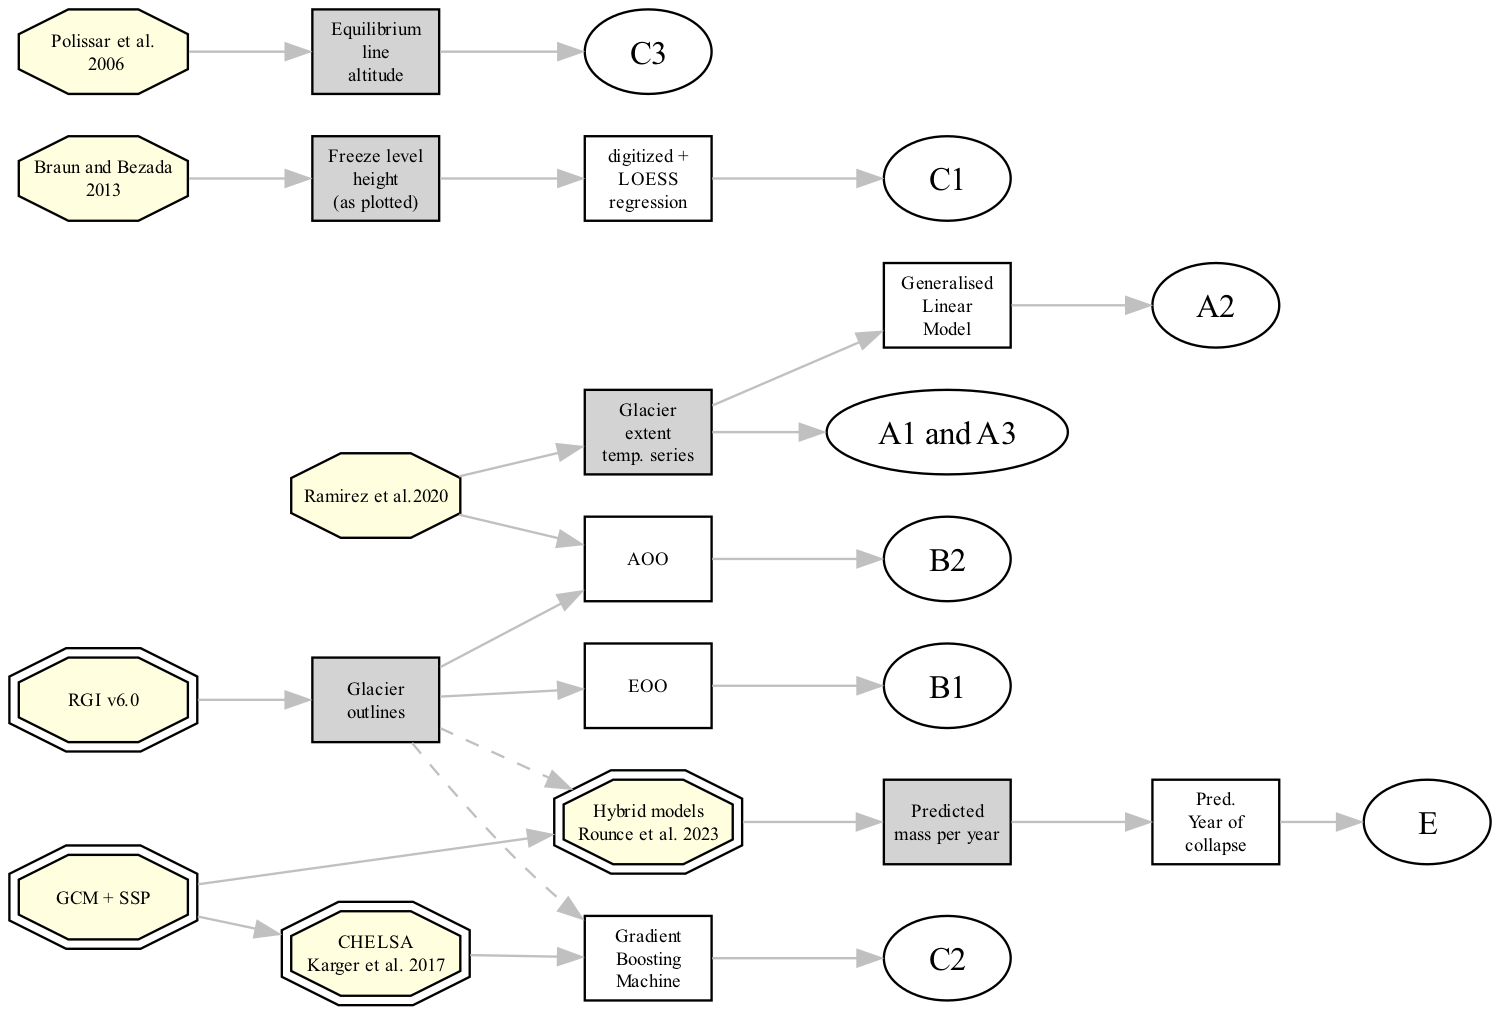
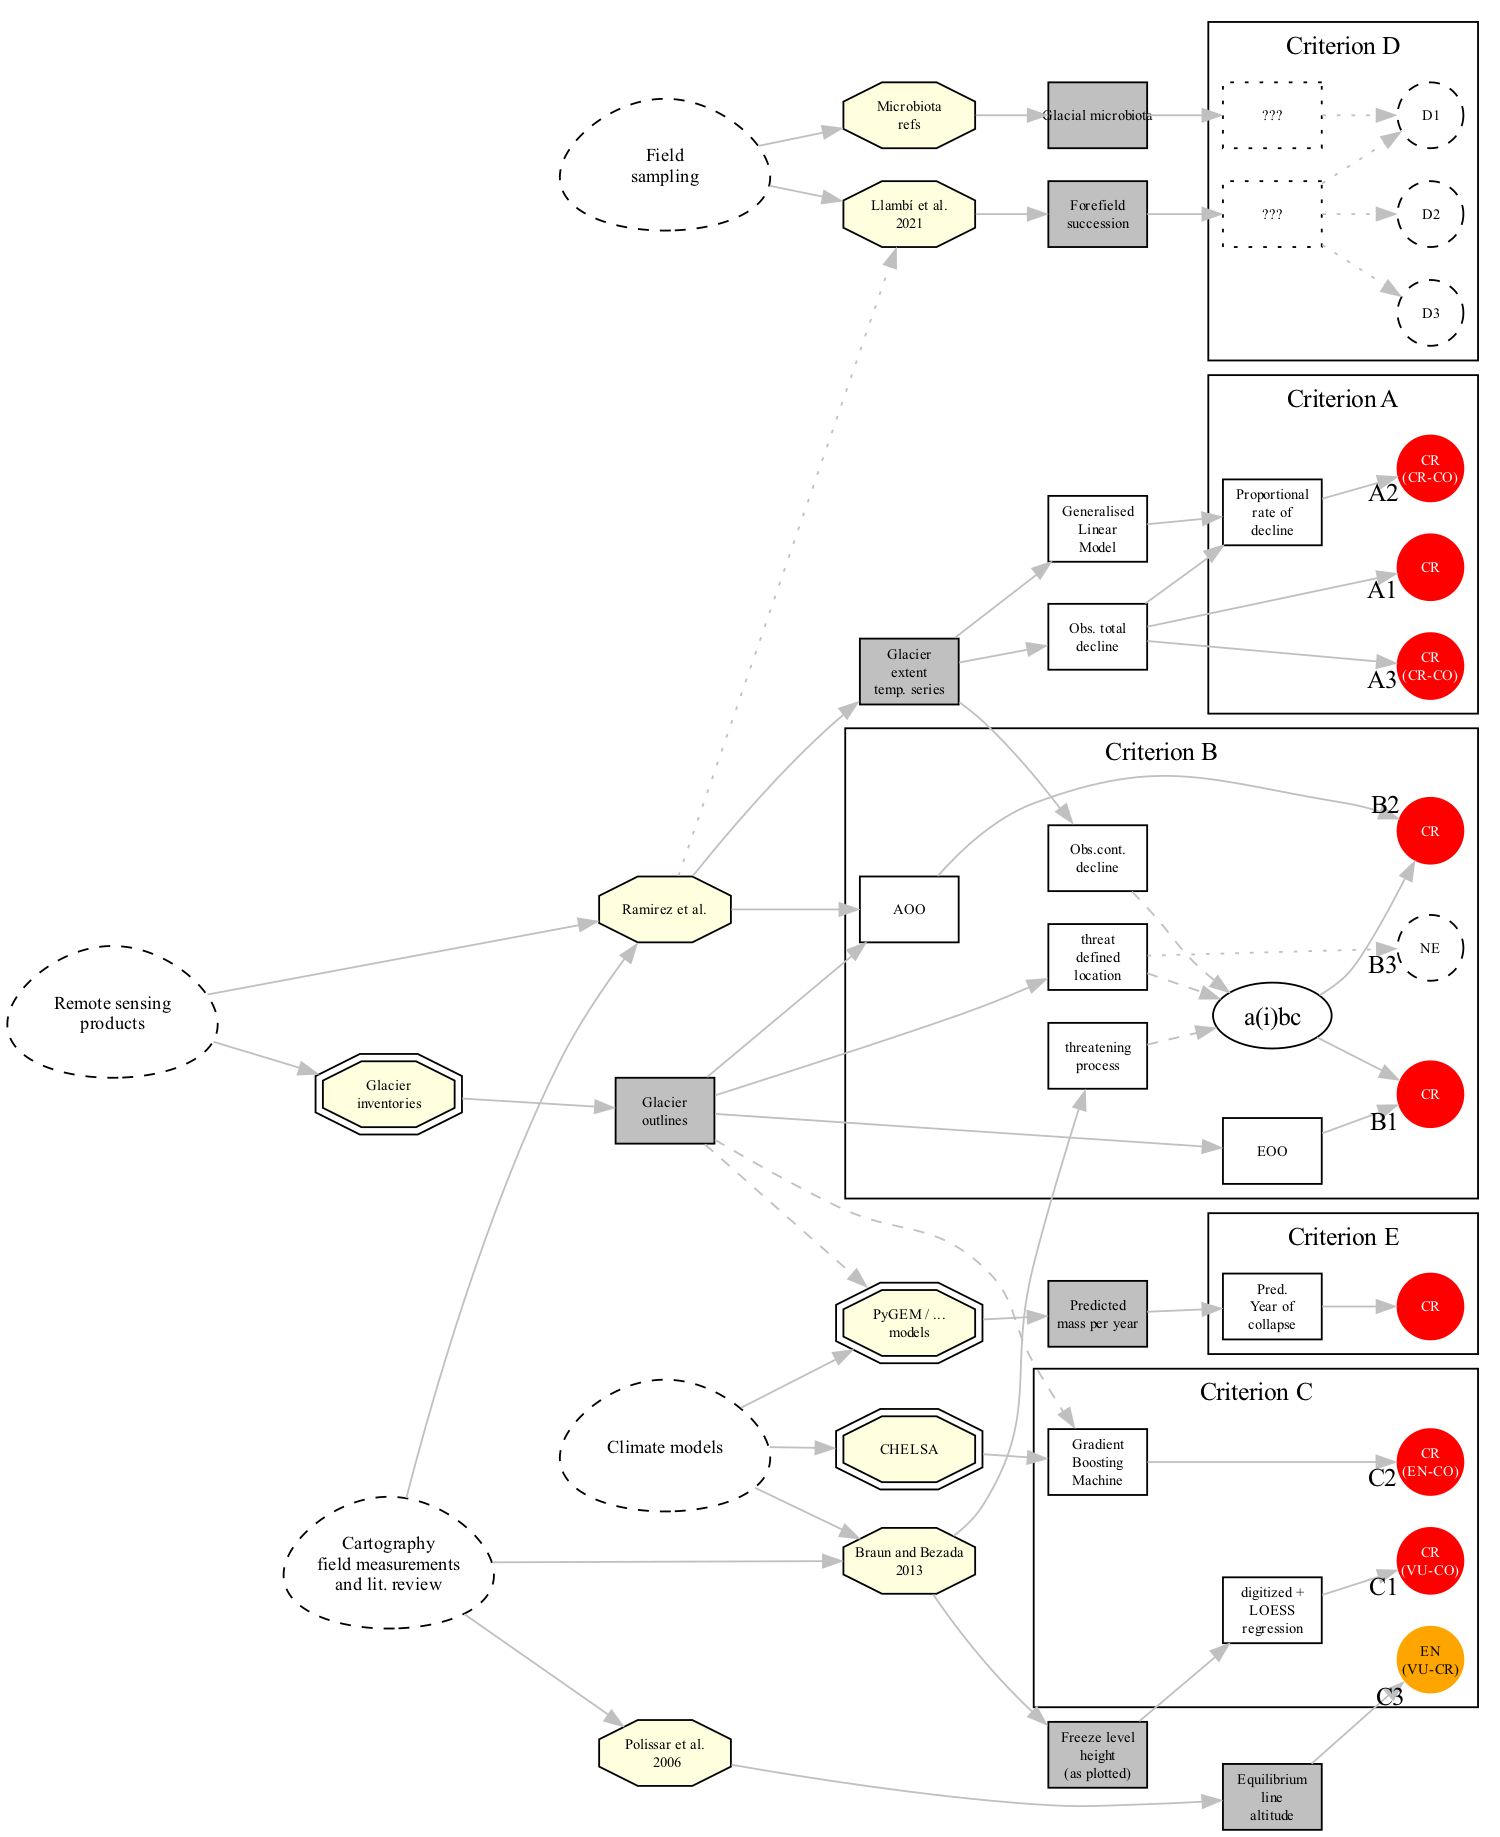
Figure Figure A.3 summarises the complete workflow from data sources to final results. Different datasources (dashed shapes), references representing local measures (simple octagons) and global datasets (double octagons), and the main data inputs (shaded boxes) and analysis steps (clear boxes and ovals) for each criterion of the IUCN Red List of Ecosystems protocol. Results for each criterion or subcriterion are indicated with coloured circles and category abbreviations.